Strip-Till and No-Till Corn Illinois
This family farm located in central Illinois is managed by multiple generations with a focus on improving soil health. The operation runs a cow-calf beef herd and uses the manure as part of the nutrient management planning. The farm does on-farm research with partners to evaluate practice implementation before adopting farm-wide.
By implementing more advanced 4R practices and cover crops in the strip-till managed corn cost per acre decreased due to lower fertilizer costs associated with variable rate applications and decreased labor and equipment costs for strip till applications of anhydrous ammonia versus full, custom application of anhydrous ammonia.
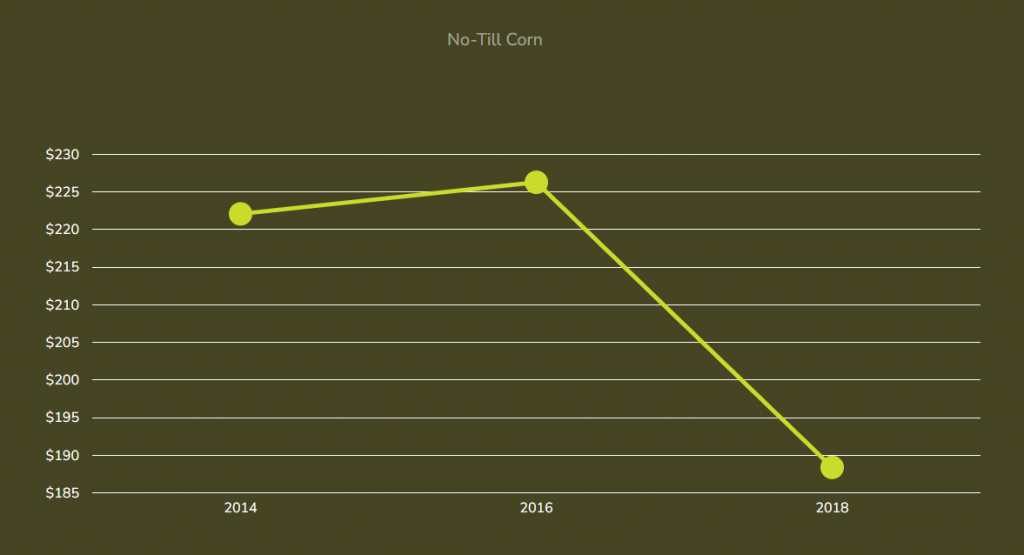
In the no-till fields, increased cost for cover crops and the change to 2.5-acre grid samples resulted in a slightly higher cost per acre in the year of intermediate practices. However, with further refinement of fertilizer application rates and greater use of variable rate P and K application in the year of advanced practices, costs decreased below that of basic or intermediate practice levels.
Outcome
Changing from basic to more advanced 4R practices, the farmer decreased cost per acre by $67.71 in the strip-till fields and $40.71 in the no-till fields while also decreasing CO2 equivalent greenhouse gas emissions by a maximum 17.5 percent. Costs were reduced even with the increase in soil sampling density and frequency and with the cost of seed, application, and termination of the cover crop.
Cost of 4R Practice Implementation for Illinois Corn


Strip-Till corn
2014 – Basic
- Fall injection of nitrogen with stabilizer
- Fall application of phosphorus and potassium – broadcast at two-year rate
- 10-acre grid soil sampling every four year
2016 – Advanced
- Fall strip till of nitrogen with stabilizer
- Fall application of phosphorus and potassium – broadcast at one-year rate using variable rate
- Cover crops
- Spring termination of cover crop
- 2.5-acre grid soil sampling every three years
2018 – Advanced
- Fall strip till of nitrogen with stabilizer
- Fall application of phosphorus and potassium – broadcast at one-year rate using variable rate
- Cover crops
- Spring termination of cover crop
- 2.5-acre grid soil sampling every three years
No-Till Corn
2014 – Basic
- Fall injection of nitrogen with stabilizer
- Fall application of phosphorus and potassium – broadcast at two-year rate
- 10-acre grid soil sampling every four years
2016 – Advanced
- Split nitrogen application: 1) fall injection of nitrogen with stabilizer and 2) Y-drop with UAN
- Fall application of phosphorus and potassium – broadcast at one-year rate using variable rate
- Cover crops
- Spring termination of cover crop
- 5-acre grid soil sampling every three years
2018 – Advanced
- Split nitrogen application: 1) fall injection of nitrogen with stabilizer and 2) Y-drop with UAN
- Fall application of phosphorus and potassium – broadcast at one-year rate using variable rate
- Cover crops
- Spring termination of cover crop
- 5-acre grid soil sampling every three years
Environmental Metrics
| Strip-Till | 2014 | 2016 | 2018 |
|---|---|---|---|
| 4R Practice Level | Basic | Advanced | Advanced |
| Nitrogen Application Rate (lbs/ac) | 186 | 216 | 216 |
| Nitrogen Use Efficiency (lb N applied/bu corn grain) | 0.98 | 1.01 | 1.06 |
| Nitrogen Balance (lb N applied – lb N harvested) | 34.1 | 44.01 | 52.85 |
| CO2 Emissions per Bushel | 9.05 | 8.29 | 8.08 |
| CO2 Percent Reduction | – | 8.4 | 10.7 |
| Yield | 189 | 214 | 203 |
| No-Till | 2014 | 2016 | 2018 |
|---|---|---|---|
| 4R Practice Level | Basic | Advanced | Advanced |
| Nitrogen Application Rate (lbs/ac) | 186 | 144 | 140 |
| Nitrogen Use Efficiency (lb N applied/ bu corn grain) | 0.78` | 0.67 | 0.69 |
| Nitrogen Balance (lb N applied – lb N harvested) | -4.48 | 44.01 | -23.8 |
| CO2 Emissions per Bushel | 7.21 | 6.17 | 5.95 |
| CO2 Percent Reduction | – | 14.4 | 17.5 |
| Yield | 237 | 216 | 203 |